A restaurant profit margin is the share of sales left as profit after costs. The figure most people mean is the pre-tax margin, and it is small: the National Restaurant Association reported a median income before taxes of 2.8 per cent of sales for US full-service restaurants and 4.0 per cent for limited-service restaurants. On $1 million of sales a year, that is $28,000 to $40,000.
Margins are measured at three levels, and each one answers a different question.
| Margin | How to work it out | What it tells you |
|---|---|---|
| Gross margin on food | Food sales minus the cost of the food used, divided by food sales | Whether recipes and prices hold up |
| Prime cost | Food, beverage and labour costs, divided by sales | Whether the costs you control most are in line |
| Pre-tax margin | Profit before tax, divided by total sales | What the business keeps after rent, utilities and everything else |
What a typical restaurant profit margin looks like
The National Restaurant Association’s Restaurant Operations Data Abstract, released on 20 August 2025, draws on financial and operating data from more than 900 US restaurants. Labour is the largest single operating expense, with payroll and benefits at a median of 36.5 per cent of sales in full-service restaurants.
Prime costs, meaning food, beverage and labour together, took a median of 65 cents of every sales dollar in limited-service restaurants. What is left pays for rent, utilities, card fees, marketing and repairs before any profit appears.
Surveys of owners can read higher. TouchBistro’s 2026 State of Restaurants Report, a survey of independent US full-service operators, says profit margins climbed back into double digits for the first time since 2022. A survey records the margin operators report, which may be measured before owner pay, rent or interest, so benchmark against accounts-based figures.
Work out your own margin from a month of figures
Take a full month, so that weekends and quiet days balance out. You need total sales, the food and drink used, labour and every other expense.
- Add up sales for the month, excluding the sales tax or VAT you collect.
- Work out food and drink used: opening stock, plus deliveries, minus closing stock.
- Add labour: wages, overtime and the employer’s contributions.
- Add everything else: rent, utilities, card processing fees, marketing, repairs, insurance and software.
- Subtract all costs from sales and divide by sales. That is your pre-tax margin.
A restaurant with $80,000 of sales in a month, $24,000 of food and drink used, $28,000 of labour and $24,000 of other costs keeps $4,000 before tax: a 5.0 per cent margin. Its prime cost is $52,000, or 65 per cent of sales.
What moves a restaurant profit margin
Because the margin is a few per cent of sales, small changes in the large costs move it most. In the example above, cutting food cost by two points of sales adds $1,600 a month and takes the margin from 5.0 to 7.0 per cent.
| Change | Effect a month | New pre-tax margin |
|---|---|---|
| Food cost down by two points of sales | $1,600 more profit | 7.0% |
| Menu prices up 3%, same guests and dishes | $2,400 more sales and profit | 7.8% |
| Ten fewer labour hours a week at $20 an hour | About $867 less labour | 6.1% |
| Voids and comps down by $500 | $500 more profit | 5.6% |
A price rise moves the margin most because the extra money arrives with no extra food or labour, as long as guests keep ordering the same dishes. Test it on a few dishes first and watch how often each one sells over the following month.
- Food cost. Cost recipes from what you were last charged, count the items that carry most of the cost every week and price dishes from their real cost. The food cost control guide sets out the routine.
- Menu mix. Move guests towards dishes that make more per plate. Menu engineering sorts each dish by how often it sells and what it makes.
- Labour. Roster to the covers you expect by hour and compare the hours worked with sales every week.
- Losses. Voids after the kitchen has started, comps, refunds and short tills come straight off the bottom line.
- Table turns. More parties through the same seats spread rent and fixed labour across more sales. The restaurant KPIs guide shows how to measure turns.
- Commission. Orders from your own online page keep the share a delivery platform would take.

Read the margin every month, line by line
To change the margin, read the lines behind it each month: food cost against sales, labour against sales, and the losses that never reach a plate.
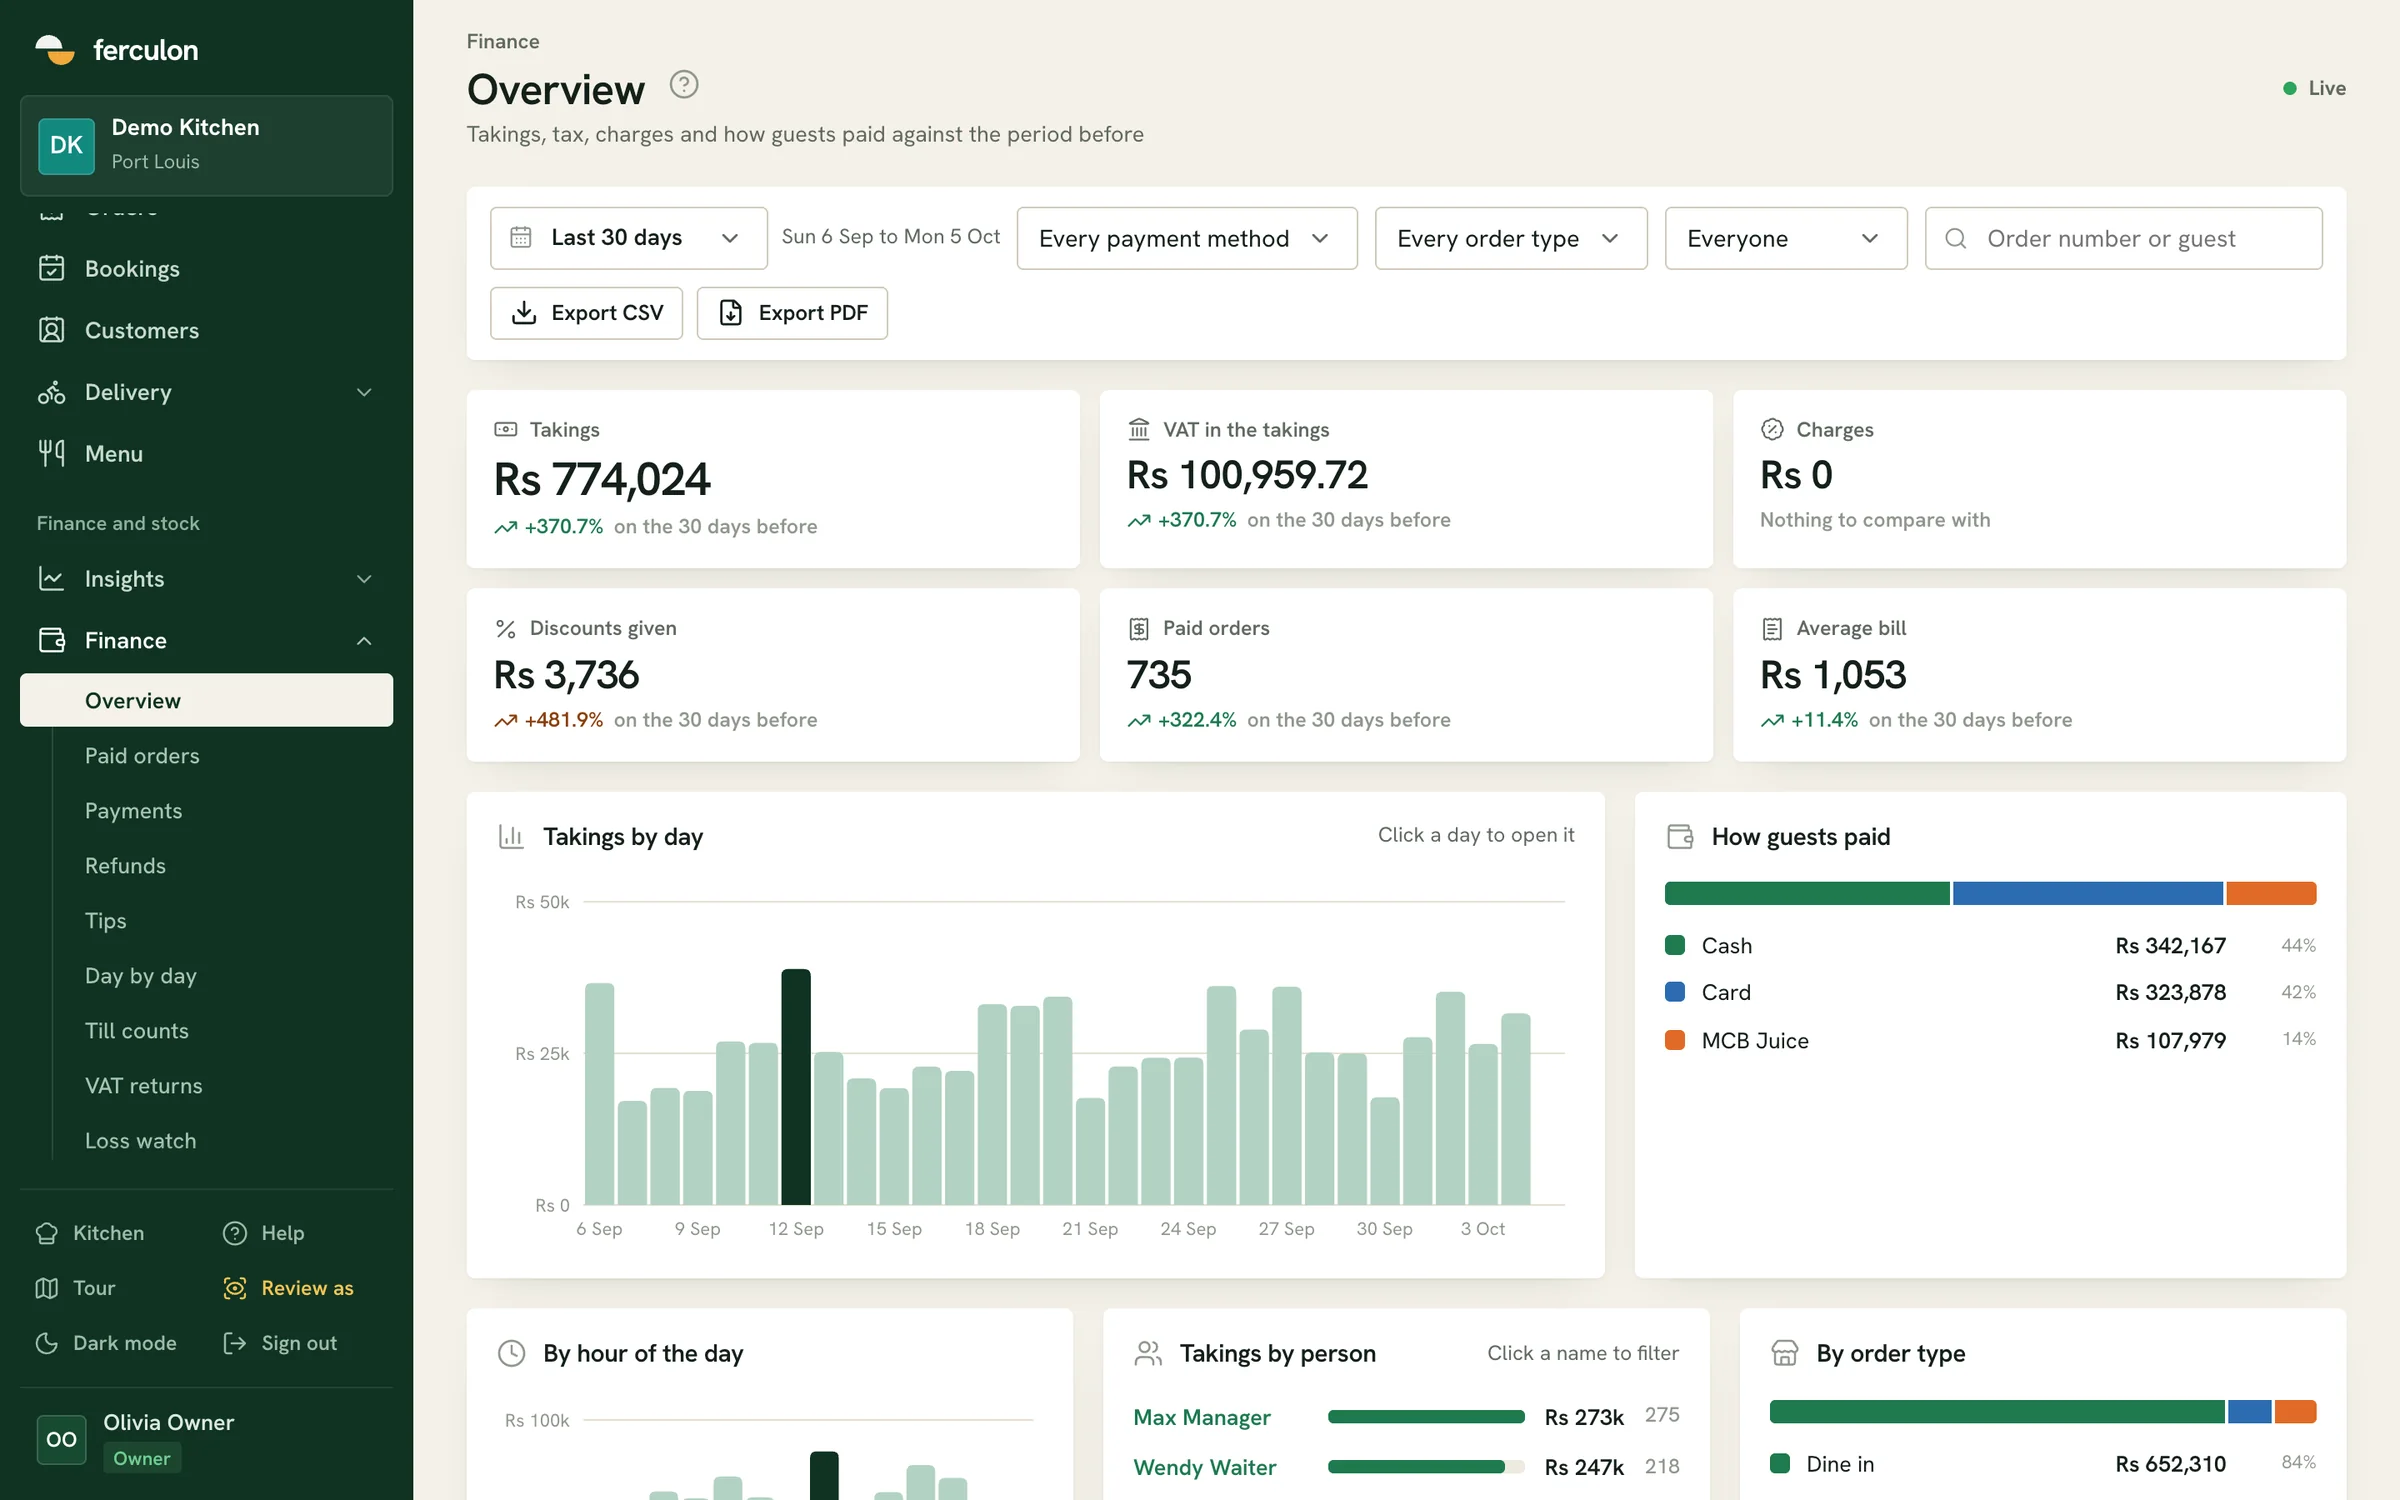
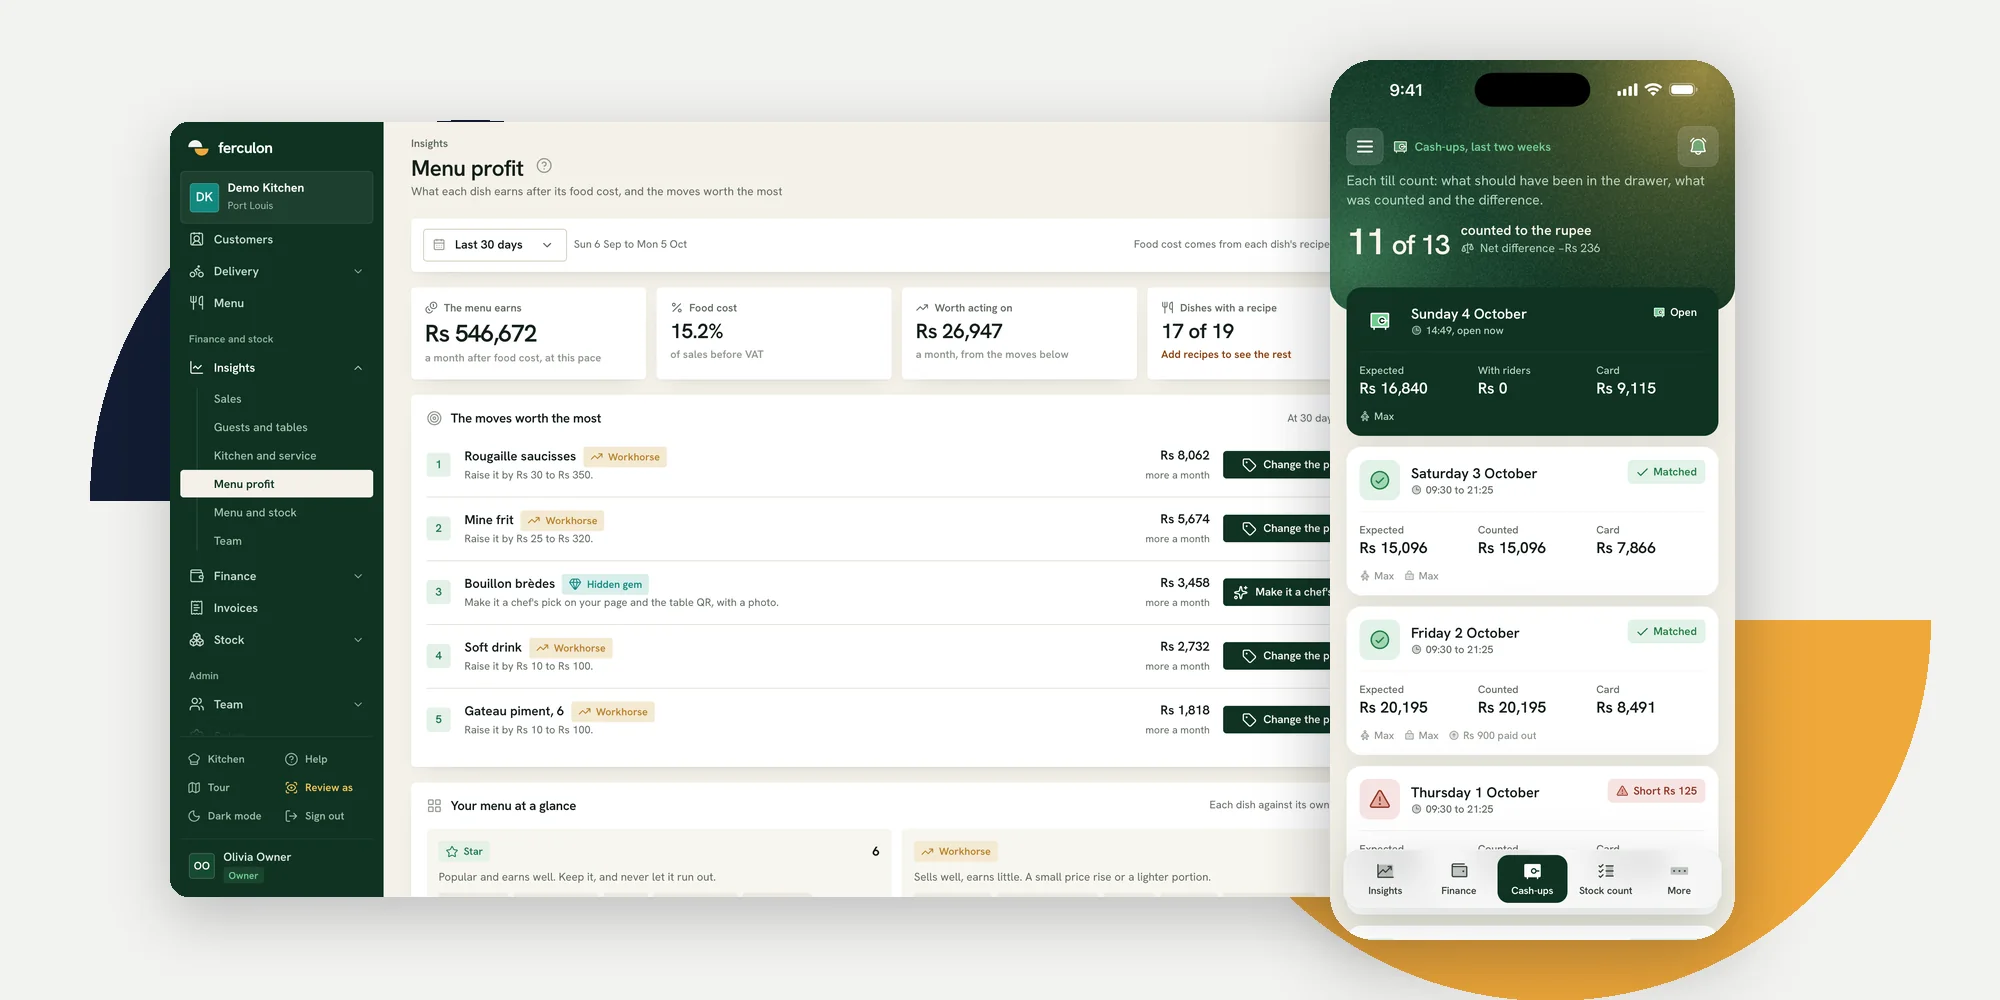
Ferculon’s back office shows recipe costs and what each dish earns after its food cost, costs staff hours from each person’s hourly rate, and keeps a loss watch of voids after the kitchen, discounts and comps, drawer openings, refunds and short tills, with each person set beside the rest of the team.
Export the month to CSV or PDF for your accountant, and compare each line with the same month last year as well as last month, because restaurant trade is seasonal.
Questions people ask
What is a good profit margin for a restaurant?
In accounts-based data, a pre-tax margin in the low single digits is typical. The National Restaurant Association reported medians of 2.8 per cent for US full-service and 4.0 per cent for limited-service restaurants in August 2025. A margin above those medians is better than half the restaurants in that data.
What is the average profit margin for a restaurant?
In accounts-based US data, the median pre-tax margin was 2.8 per cent of sales for full-service restaurants and 4.0 per cent for limited-service restaurants, according to the National Restaurant Association in August 2025. Surveys of owners often report higher figures because they may count costs differently.
How do you calculate restaurant profit margin?
Subtract all costs for the month from total sales, then divide by total sales. Use food and drink cost from stock counts and deliveries, labour including employer contributions, and every other expense, including rent, card fees and software.
What is prime cost in a restaurant?
Prime cost is food, beverage and labour costs together, as a share of sales. The National Restaurant Association reported a median of 65 cents of every sales dollar in US limited-service restaurants in its August 2025 data.
Why are restaurant profit margins so low?
Food and labour take most of every sales dollar, and rent, utilities and card fees take much of the rest. Labour is the largest single expense, with payroll and benefits at a median of 36.5 per cent of sales in US full-service restaurants in the Association’s data.
How can a restaurant increase its profit margin?
Work on the largest costs first: cost recipes and price from them, move guests towards dishes that make more per plate, roster to expected covers, cut voids and waste, and take more orders through your own page to avoid commission.