Restaurant KPIs are the few numbers that show whether a service, a week and a month went well: sales, covers, average spend per guest, table turnover, food and labour cost, ticket times and how many booked guests turn up. Each one needs a formula, a time to check it and a person who acts on it.
These twelve cover most restaurants. Use the same period for every part of a formula, such as one service, one week or one month.
| KPI | Formula | When to check |
|---|---|---|
| Sales | Total sales for the period, excluding sales tax or VAT | Daily |
| Covers | Number of guests served | Daily |
| Average spend per guest | Sales divided by covers | Weekly |
| Average bill | Sales divided by the number of paid bills | Weekly |
| Table turnover rate | Parties seated divided by the number of tables | Weekly |
| Time at the table | Average minutes from seating to payment | Weekly |
| Tables in use | Share of opening hours each table has guests | Weekly |
| Food cost percentage | Cost of food used divided by food sales, times 100 | Weekly |
| Labour cost percentage | Labour cost divided by sales, times 100 | Weekly |
| Prime cost | Food, beverage and labour cost divided by sales | Monthly |
| Ticket time | Minutes from an order reaching the kitchen to being marked ready | Each service |
| No-show rate | Booked parties that did not arrive divided by all booked parties | Weekly |
The KPIs to read every day
Daily numbers are for the next service. Compare sales and covers with the same weekday last week, because a Tuesday is only comparable with a Tuesday. Look at the slowest tickets and the dishes that sold out, and ask why before the next service starts.
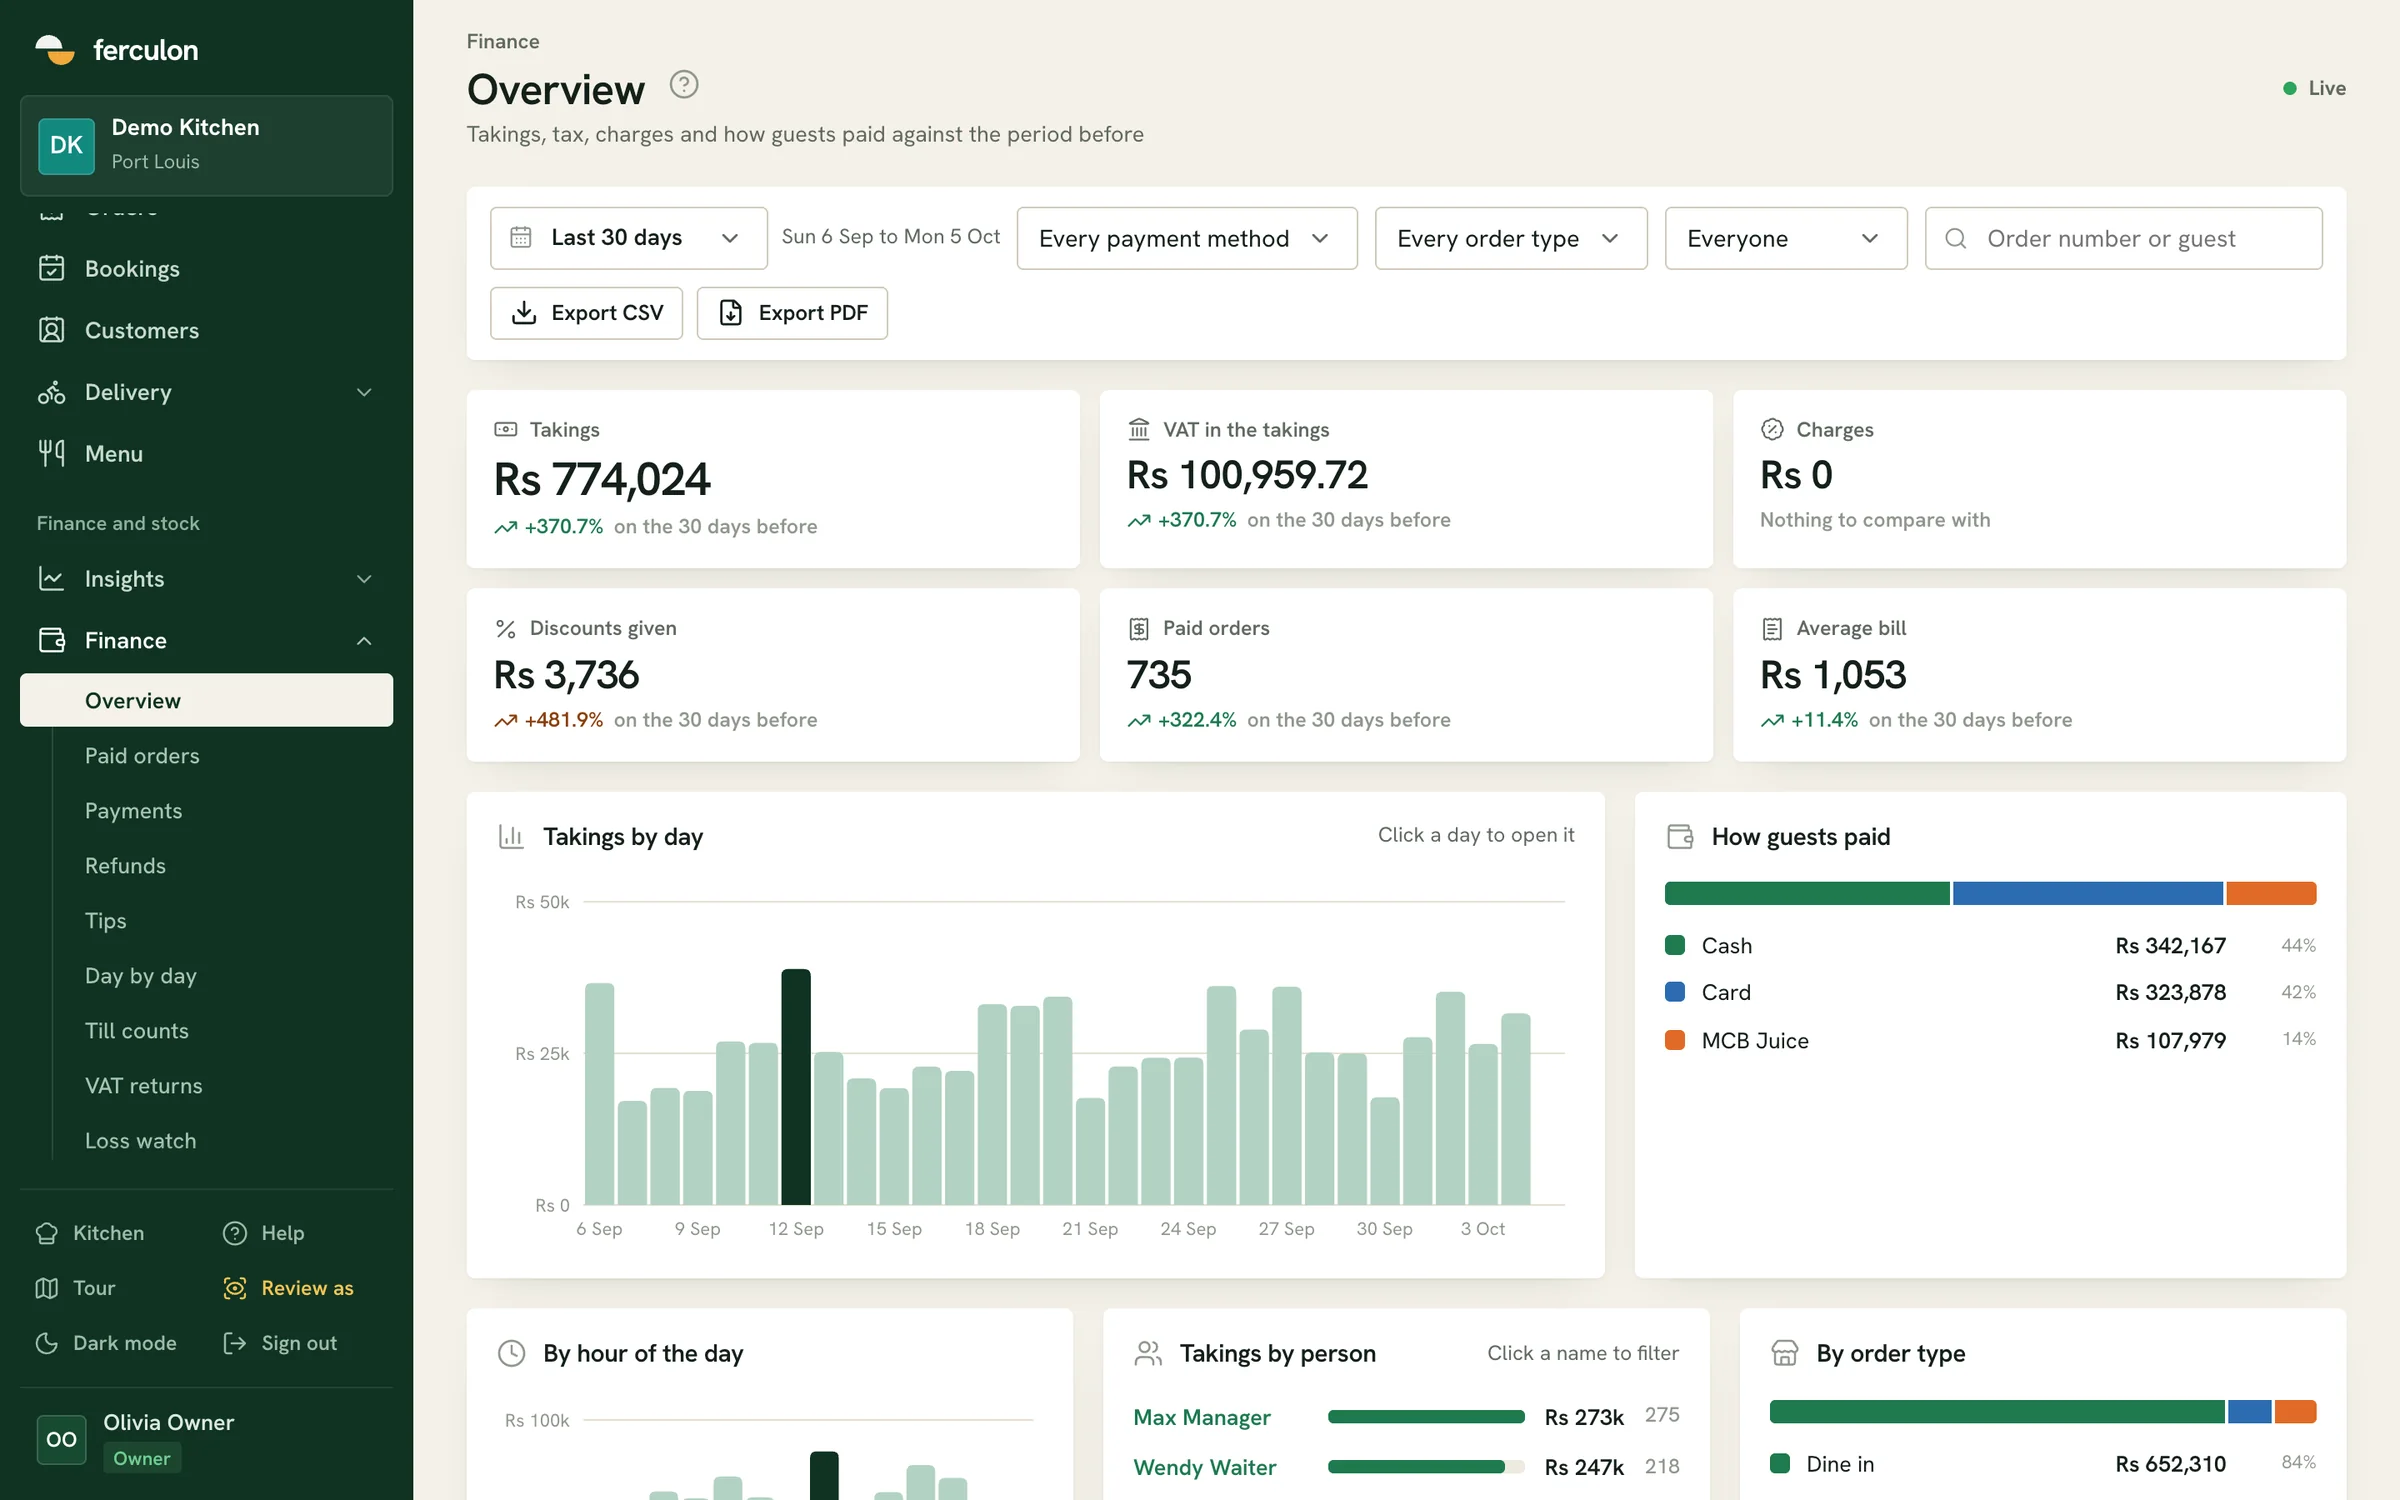
Ferculon’s Today screen opens on sales so far against the same day last week, sales by hour and a short brief of the day, so the manager starts the shift with the comparison already made.
Table turnover rate and time at the table
Table turnover rate is the number of parties each table seats in a day or a service: parties seated divided by the number of tables. A room of 10 tables that seats 21 parties at lunch turns 2.1 times. Time at the table is the other side of the same number, because the longer each party stays, the fewer turns the room can make.
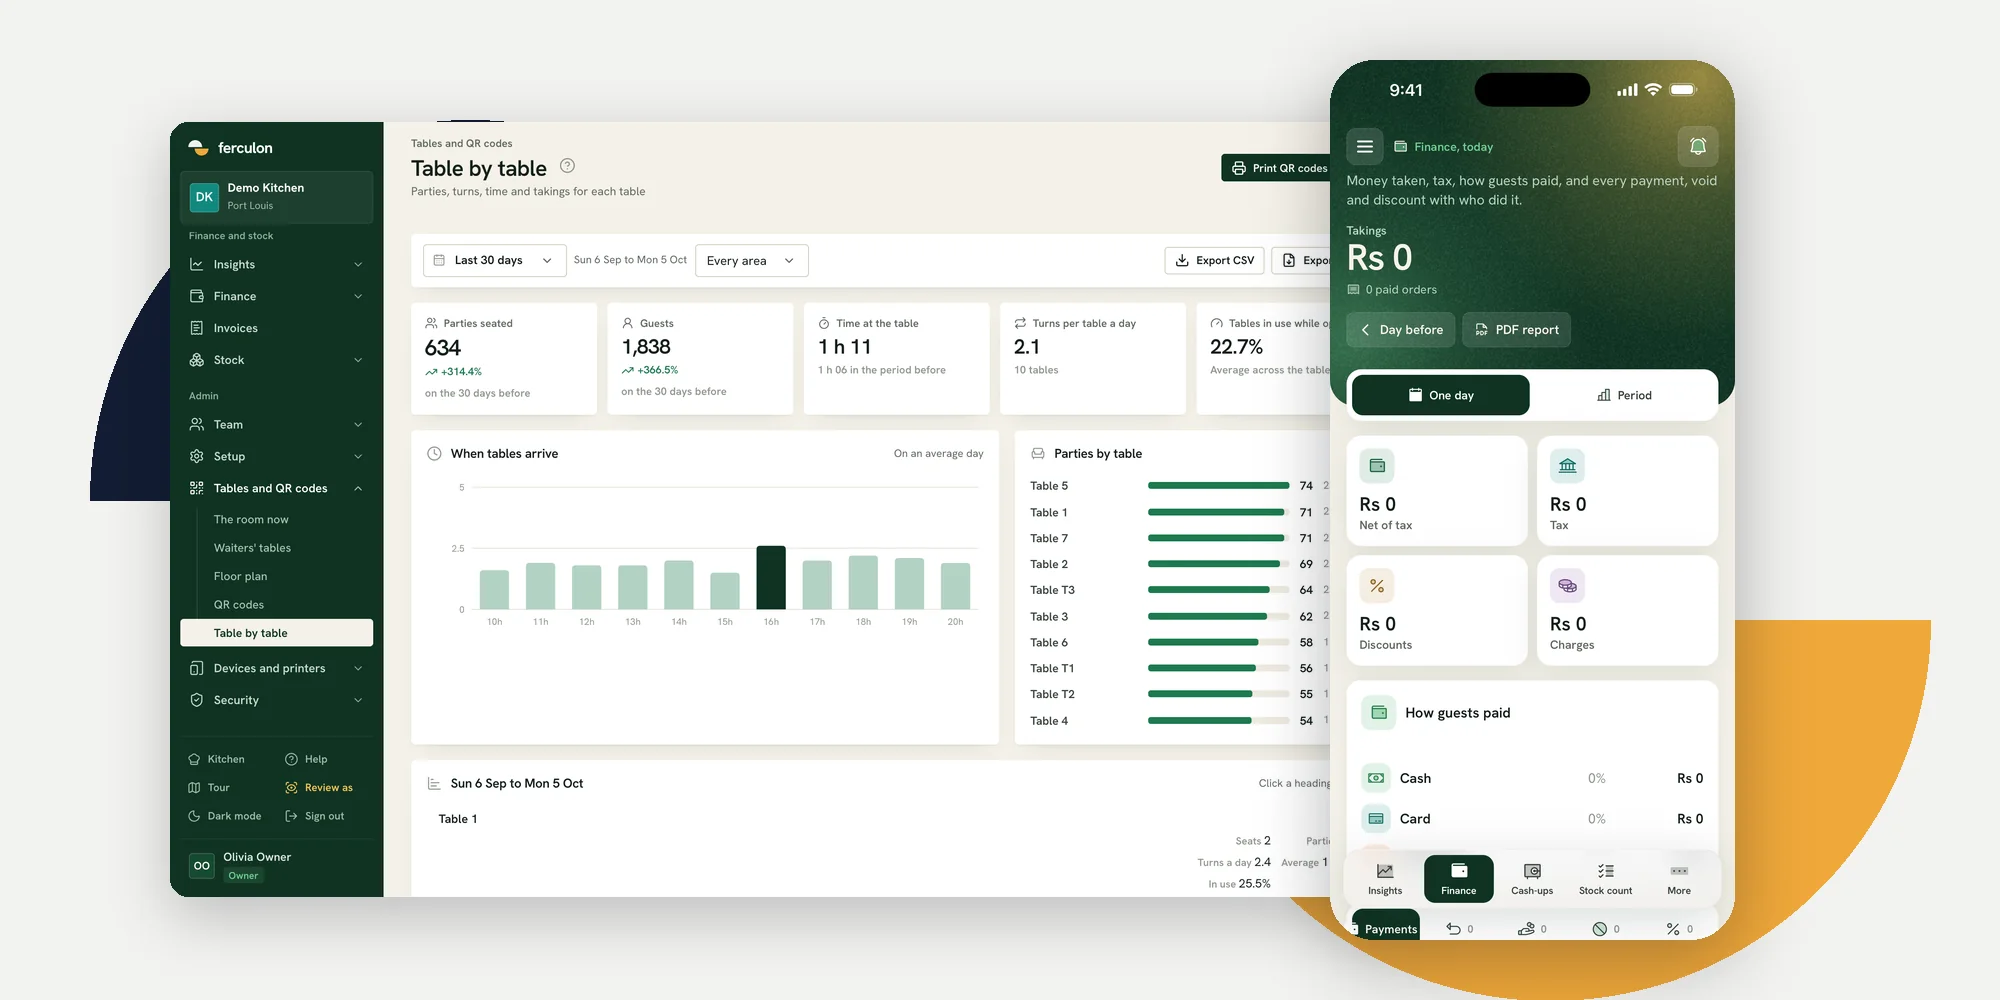
Read both by time of day and by party size. Large parties stay longer, and a slow turn at a busy lunch costs more than one at the end of dinner. Ferculon’s table report shows parties seated, guests, time at the table, turns per table a day and the share of opening hours each table is in use, table by table.

When time at the table runs long, find where it goes. Ferculon’s guests and tables view splits it into the wait for the first order, the time from the pass to the table and the wait for the bill, which are three different problems with three different owners.
Food cost, labour cost and prime cost
Cost KPIs are weekly and monthly numbers. Food cost percentage needs a stock count, so it is only as good as the count. Labour cost percentage needs every hour worked, including shifts nobody clocked out of. Together they make prime cost, the share of sales spent on food, drink and labour.
In the National Restaurant Association’s August 2025 data, prime costs were a median of 65 cents of every sales dollar in US limited-service restaurants, and payroll and benefits a median of 36.5 per cent of sales in full-service restaurants. Use them as a starting point, then follow your own trend month by month.
Kitchen and guest KPIs
Ticket time is the minutes from an order reaching the kitchen to being marked ready. Track the average, the time within which half and nine in ten tickets are ready, and the share that take over 20 minutes, by station and by hour. An average well above the half-way time usually means a few slow dishes are holding up the rest.
Guest KPIs show whether people come back. Count regulars, guests who book ahead and the no-show rate. In Ferculon’s customer records, the demo restaurant counts a regular at four visits or more and marks a guest as often a no-show at 30 per cent of their bookings or more.
Sales per seat hour for a busy room
When the room is often full, sales per seat hour shows how hard each seat works. Divide sales by the number of seats times the hours you are open. A 40-seat room open for 10 hours that takes $8,000 makes $20 per seat hour.
The number rises when either the spend or the turns go up, so both the kitchen and the floor can move it. Read it by service: a lunch that turns quickly at a low spend can earn as much per seat hour as a slow dinner at a high one.
A KPI routine by day, week and month
- Daily, before service: sales and covers against the same weekday last week, and yesterday’s slowest dishes.
- Weekly: average spend, table turns, time at the table, food cost, labour cost and the no-show rate.
- Monthly: prime cost, the pre-tax margin and the trend of every weekly number.
- One owner per number: the head chef for ticket times and food cost, the floor manager for turns and no-shows, the owner for prime cost.
Export the reports to CSV or PDF when your accountant needs them, and keep the same periods so each month compares with the one before. For the margin itself, see the restaurant profit margin guide.
Questions people ask
What are the most important KPIs for a restaurant?
Sales, covers, average spend per guest, table turnover rate, food cost percentage, labour cost percentage, prime cost and ticket time cover most restaurants. Add the no-show rate if you take bookings.
How do you calculate table turnover rate?
Divide the number of parties seated by the number of tables for the same period. Ten tables that seat 21 parties in a lunch service have a turnover rate of 2.1.
What is a good prime cost for a restaurant?
In the National Restaurant Association’s August 2025 data, prime costs were a median of 65 cents of every sales dollar in US limited-service restaurants. Track your own prime cost monthly and compare it with your own trend.
How often should a restaurant review its KPIs?
Sales, covers and ticket times daily; costs, turns and no-shows weekly; prime cost and the margin monthly. Keep the same periods so each number compares with the one before.
What should a restaurant KPI dashboard show?
Sales and covers against the same weekday last week, average spend, table turns and time at the table, ticket times, food and labour cost, and the no-show rate. Ferculon’s Today screen, table report, guests and tables view and kitchen report cover these from your own orders.
What is average spend per guest?
Sales divided by covers for the same period. It moves with prices, with the menu mix and with how many guests add a starter, a drink or a dessert.