Menu engineering is a way to review each dish by how often guests order it and what remains after its direct food cost. For a restaurant in Mauritius, start with your own recipes, actual paid orders and a short list of changes you can test. The result is a decision aid, not a promise that a price change will bring more profit.
| For each dish | Record | Why it matters |
|---|---|---|
| Menu price | The actual selling price and any options sold | A printed price alone misses discounts and option choices |
| Recipe cost | Ingredient quantities at current unit costs | A missing recipe makes the margin unknown |
| Paid portions | How many of that dish were sold in the period | Popularity needs a real denominator |
| Contribution per portion | Net selling price less direct recipe cost | Shows cash left before labour, rent and other costs |
| Practical constraint | Prep time, waste, availability and guest feedback | A neat ranking can miss why a dish matters |
Collect comparable records before doing menu engineering
Choose one recent period and one section, such as mains or desserts. Export or review the paid portions for that period, then check the current recipe for each dish. Compare like with like: a dessert should not have to beat a main course on absolute sales or contribution. The EHL hospitality analysis describes sales mix and contribution margin as the two core measures, but also warns that item economics alone do not describe the whole dining experience.
- Check the recipe. Confirm the portion, ingredient units, yield and current purchase cost with the kitchen. Include garnishes and options that are part of that dish.
- Choose the sales period. Count paid portions over the same dates for every dish in the section. Keep voids and unpaid orders out of that comparison.
- Check the selling price. Use what guests actually paid where discounts and options change the result. Decide whether the menu price includes tax before comparing it with cost.
- Write down the operational context. Note long preparation, scarce ingredients, high waste or a dish that brings guests in even if its margin is modest.
The inventory setup guide explains why supplier deliveries, counts and recipe units need to be consistent. If those records are incomplete, first fix the data. A calculation based on an old pack cost may look precise while giving the wrong decision.
Calculate contribution without confusing it with profit
The basic calculation is net selling price less direct recipe cost. The BCcampus food service textbook shows how recipe and portion costs feed menu pricing, and why one food-cost percentage does not fit every restaurant. In Mauritius, keep the tax treatment consistent when comparing dishes. Use the following formula with your own records.
| Worksheet line | Calculate | What it means |
|---|---|---|
| Net selling price | Actual price with any included tax removed | Price after removing any included tax for this comparison |
| Direct recipe cost | Sum of the current ingredient costs per portion | Ingredients used for one portion |
| Contribution per portion | Net selling price minus direct recipe cost | Amount left before labour, rent and overhead |
| Paid portions in period | Count of paid portions | A count from the same period as the other dishes |
| Period contribution | Contribution per portion multiplied by paid portions | A period total, before other operating costs |
Contribution after ingredients is not net profit: labour, power, packaging, rent, payment charges, waste and overhead still need attention. A dish with a lower food-cost percentage can bring in fewer rupees per portion than one with a higher percentage. Read both measures before changing a menu.
Sort dishes by popularity and contribution in their own section
A familiar menu engineering matrix has four groups. Set the popularity and contribution comparison using the dishes in the same section, then inspect the exceptions. A new dish needs time to gather orders; one sold mainly at weekends should be reviewed against a period that includes comparable weekends. The matrix points to questions, not automatic deletions.
| Group | What the data says | First question for the owner |
|---|---|---|
| Star | Popular, with strong contribution | Can we keep its recipe, quality and availability consistent? |
| Workhorse | Popular, with weaker contribution | Did ingredient cost rise, or would a careful price or recipe test help? |
| Hidden gem | Less ordered, with strong contribution | Can guests find it and understand why to choose it? |
| Rethink | Less ordered, with weaker contribution | Does it serve a purpose that the numbers miss? |
The food-cost guide covers where recipe costs can drift. Here the extra step is to look at guest demand alongside the cost. EHL cautions that a dish can shape the restaurant’s identity or take unusual time and space, even if its position in a simple matrix looks clear. Ask the chef and floor lead what the numbers cannot tell you.
Test one menu change before rewriting the whole card
- For a workhorse: check supplier cost and portion first. If you test a price change, compare sales volume and guest response as well as contribution.
- For a hidden gem: make the name and description clearer, check the photo and ask the team to recommend it. Do not assume a better position guarantees demand.
- For a star: protect consistency and stock. If it sells out regularly, record how many opportunities were lost before deciding to prepare more.
- For a dish to rethink: ask whether it supports a dietary choice, a loyal group of guests or an important part of the menu. Trial a recipe or placement change before removing it.
Write down what changed and when. Compare a similar service period afterwards, including the effect on neighbouring dishes. A higher contribution on one plate can still leave the restaurant worse off if guests move away from a more valuable combination or if prep slows the kitchen. There is no fixed percentage or universal timetable that replaces your own service data.
Read menu profit in the Ferculon demo, then inspect its inputs
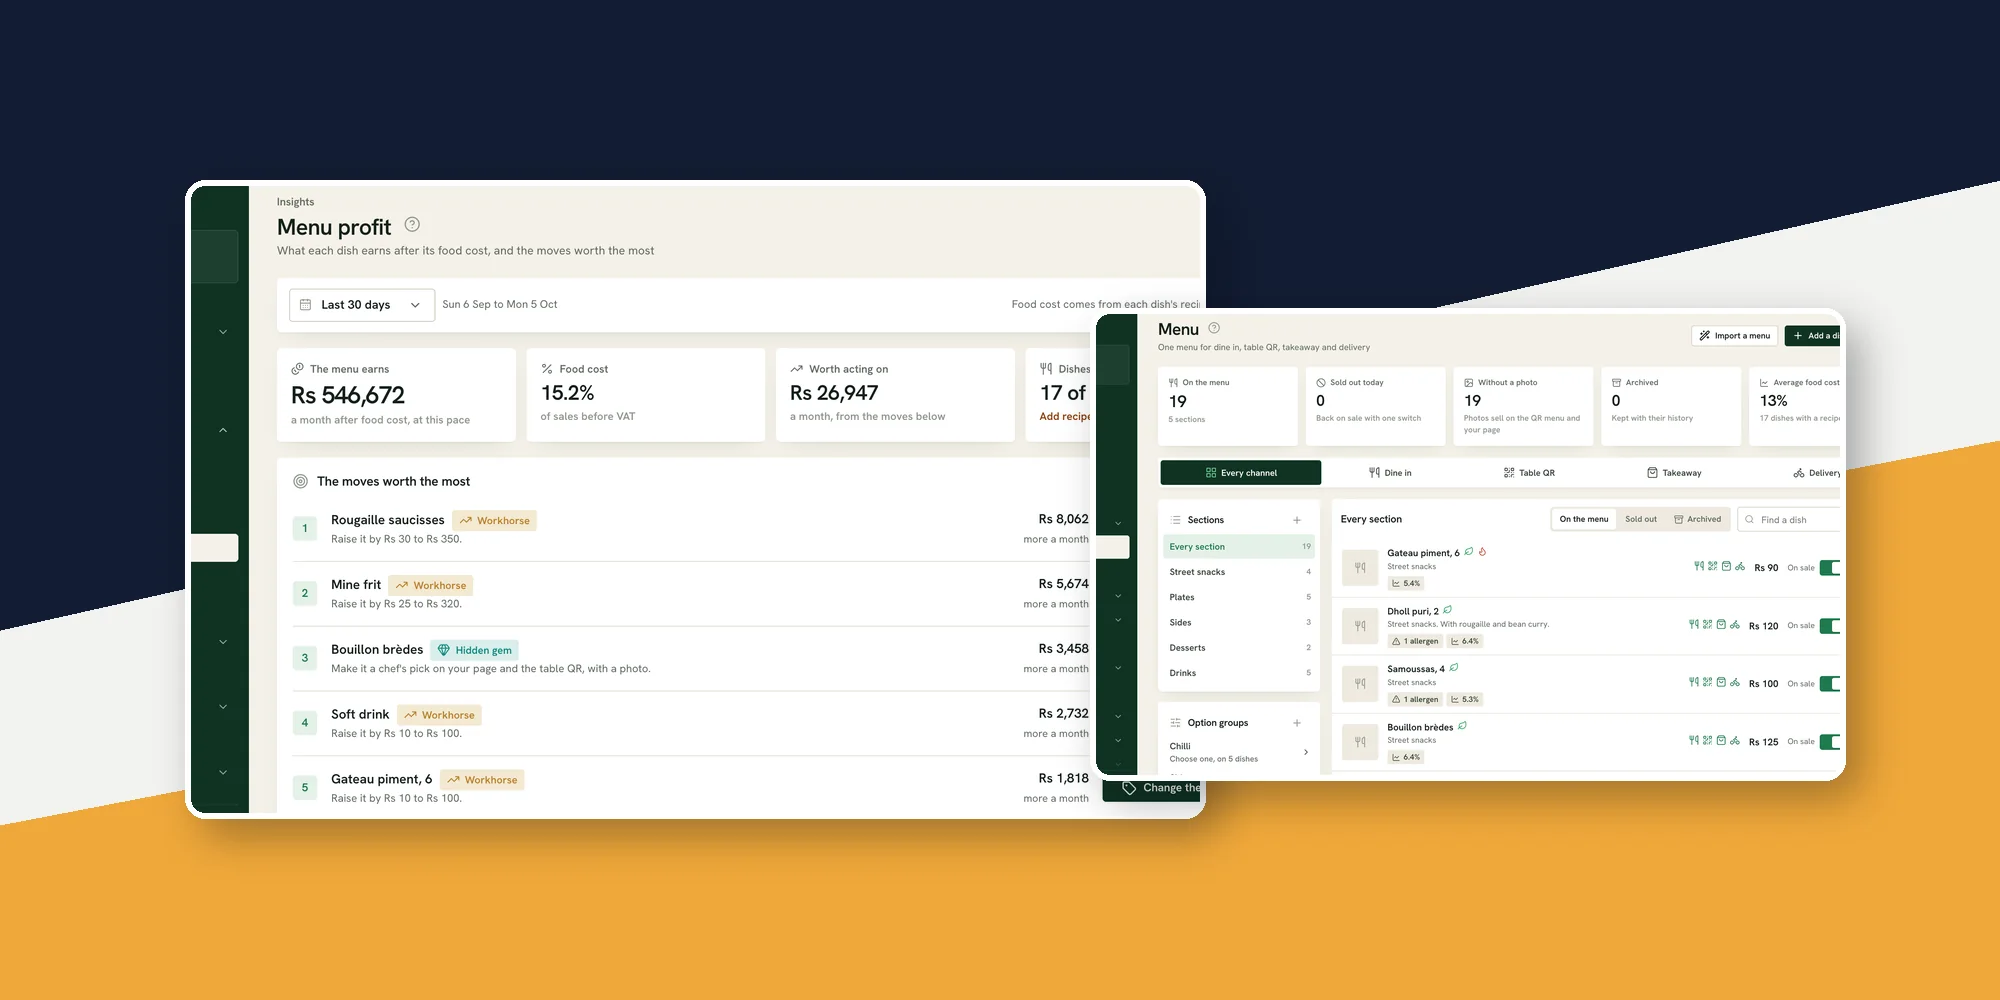
In Ferculon’s back office, open Insights and then Menu profit. Choose a date range. The screen lists dishes with a recipe separately from dishes it cannot cost, shows the leading suggested moves and groups each dish within its own menu section. The demo below contains sample restaurant data; its rupee amounts are examples of what the interface displays, not results or promises for another venue.
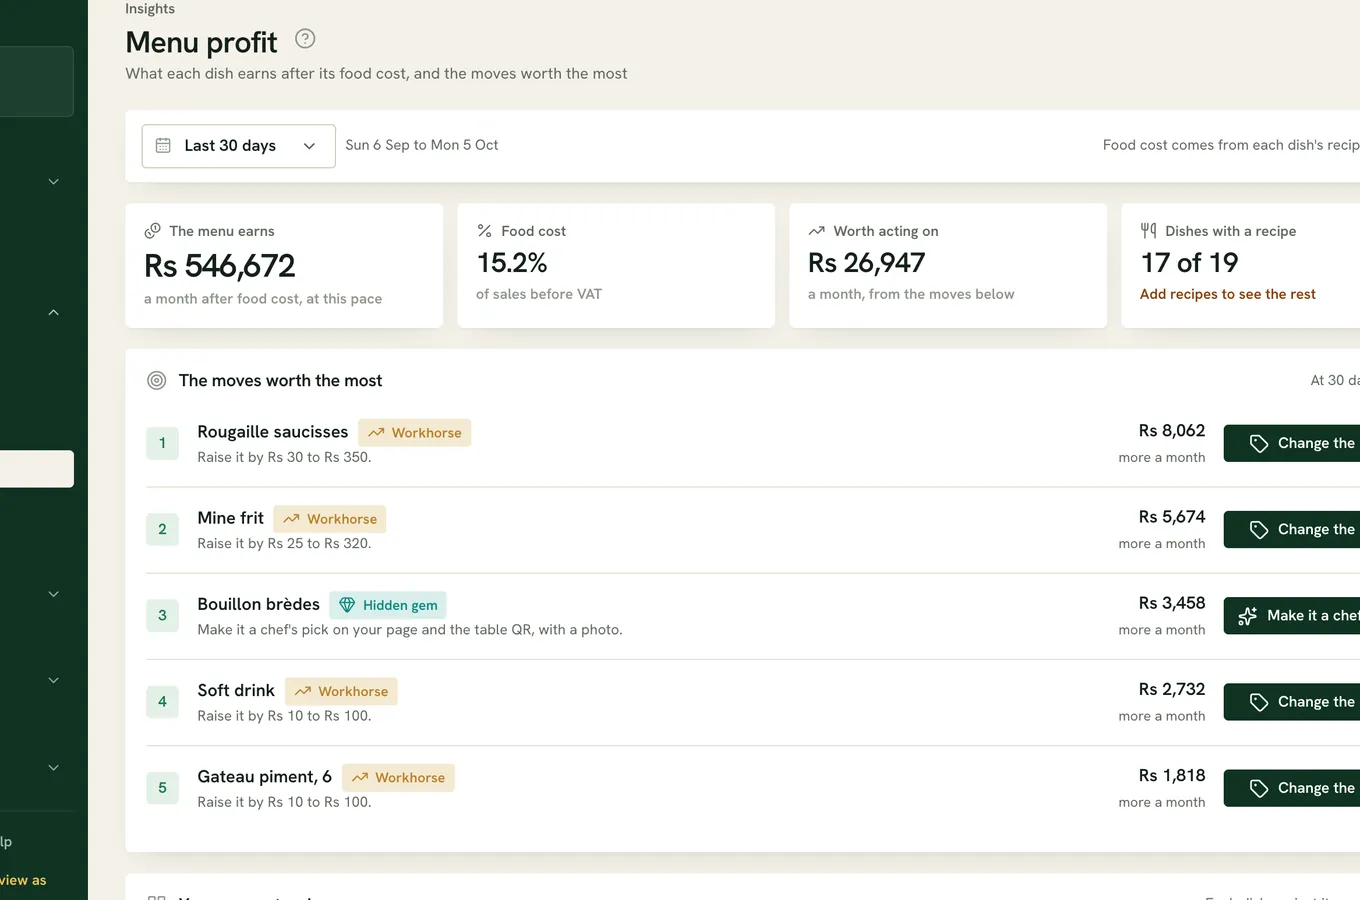
The calculation comes from paid orders and saved recipes in the product code. It removes configured included tax from the selling price before comparing it with recipe cost. For popularity it compares a dish with others in the same section, not with the entire menu. A dish without a recipe is marked uncosted. The suggested monthly value uses the recent period’s sales pace, so it is a scenario rather than a forecast or a guaranteed return. Review it with the chef before accepting a price or promotion.
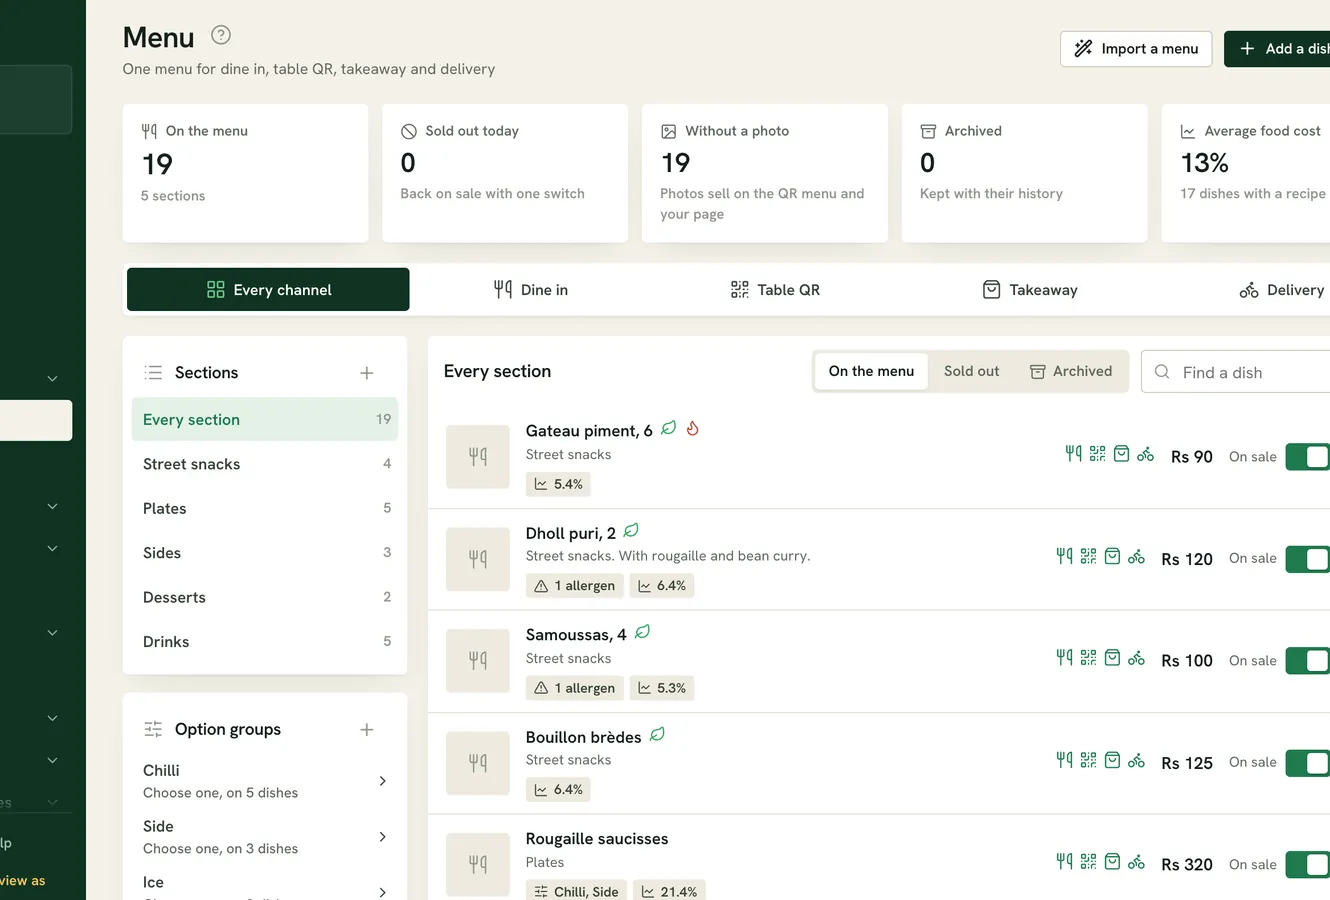
Open Menu to check a dish, its section, price, options and recipe. The screenshot shows the demo restaurant’s editable menu; it is not a published menu for another business. If ingredient cost, portion size or option pricing is wrong, correct that input before relying on a margin. The Intelligence overview shows how these reports fit with stock and service records, while pricing explains how to request a quote.
Know what the matrix cannot decide for your restaurant
A menu screen cannot measure why a guest returns, whether a dish is central to your identity, or what a difficult preparation does to a busy kitchen. Nor does a calculated margin include every cost of running the restaurant. Use the report to choose a question for the next team review, then make one observable change. Ask for a Ferculon demonstration using a sample of your own menu if you want to see how the workflow handles missing recipes and mixed sections.
Questions people ask
What is menu engineering for a restaurant?
It is the review of dishes by both guest demand and contribution after direct food cost. Start with paid portions and current recipes for one period, compare dishes within a section, and use the result to test a practical change.
What are the four menu engineering categories?
The common categories are stars, workhorses, hidden gems and dishes to rethink. They combine stronger or weaker demand with stronger or weaker contribution. Each category starts a question; it does not order you to change a dish.
How do I calculate a dish’s contribution?
Take the actual selling price, remove any included tax for the comparison, and subtract the direct recipe cost per portion. Multiply that contribution by paid portions in the same period to see its period contribution. This is before labour, rent and other operating costs.
Can Ferculon do menu engineering without recipes?
It can show paid sales, but it cannot calculate a dish’s food-cost contribution without a saved recipe. Menu profit marks such dishes as uncosted. Check ingredient units and supplier costs before treating any margin as reliable.
Will a suggested menu change increase profit?
No result is guaranteed. A suggested monthly value is based on the recent sales pace and recipe data, while guest behaviour and operating costs can change. Review the inputs, test one move and compare a similar period afterwards.